Upstream efficiency and downstream productivity: The influence of mountain streamflow on nearshore metabolism in a large, oligotrophic lake across drought and wet years.
Current warming trends and the expected variability in the timing and intensity of precipitation in mountain regions could also alter the availability of key resources and as well as physical processes, with unknown effects on downstream ecosystem energy fluxes (i.e., primary productivity - GPP and ecosystem respiration - ER). Therefore, we set out to characterize seasonal rates of productivity along the nearshore of Lake Tahoe across multiple catchments that accumulate different amounts of precipitation and have unique flow regimes for three consecutive and extreme hydroclimatic years (2021 to 2023).
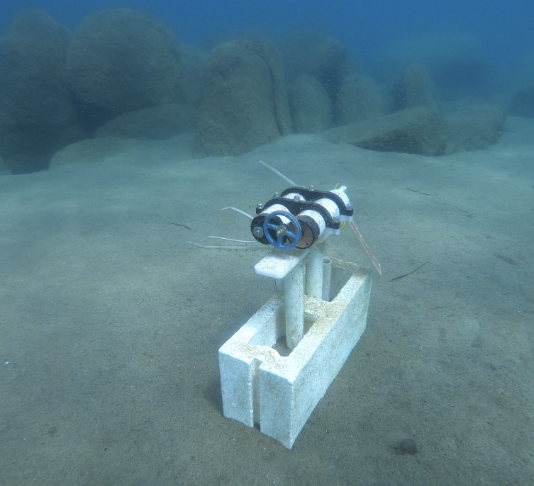
We deployed networks of dissolved oxygen sensors (three sensors per-shore) to create a large high resolution time series of modeled metabolism across four different nearshore (3 m deep) locations. Past work in Tahoe has focused on synoptic discrete measures of algal biomass and bottle incubations to estimate rates of GPP and ER. Here we sought to capture relative quick nearshore responses to precipitation events as well as seasonal regimes by capturing daily GPP and ER, weather, and streamflow dynamics.
Areas near inflowing streams tended to be more heterotrophic, while areas away from streams appeared more autotrophic. Intra-annually, we typically observed elevated productivity at all locations in the spring and late fall likely following patterns of turbulent lake mixing and carbon and nutrients distributions. During 2023 the water yield increased by 83% at both west and east shore creeks and lake level increased by up to 1.65 m. We additionally observed metabolic regimes with higher annual GPP during dry (2021) relative to wet (2023) hydroclimatic conditions. This trend supports similar work in mountain lakes where drier years (2021) favored autotrophic metabolism, while wetter hydroclimatic conditions (2023) favored heterotrophic metabolism. We expect that all nearshore locations in 2023 were subject to prolonged run-off conditions (e.g. heightened material transport as well as enhanced turbulent mixing) following the historic winter and ultimately favored heterotrophic conditions in the nearshore.
Co-authors: Heili Lowman, Jasmine Krause, Leon Katon, Ramon Naranjo, Facundo Scordo, Adrian Harpold, Sudeep Chandra, and Joanna Blaszczak.
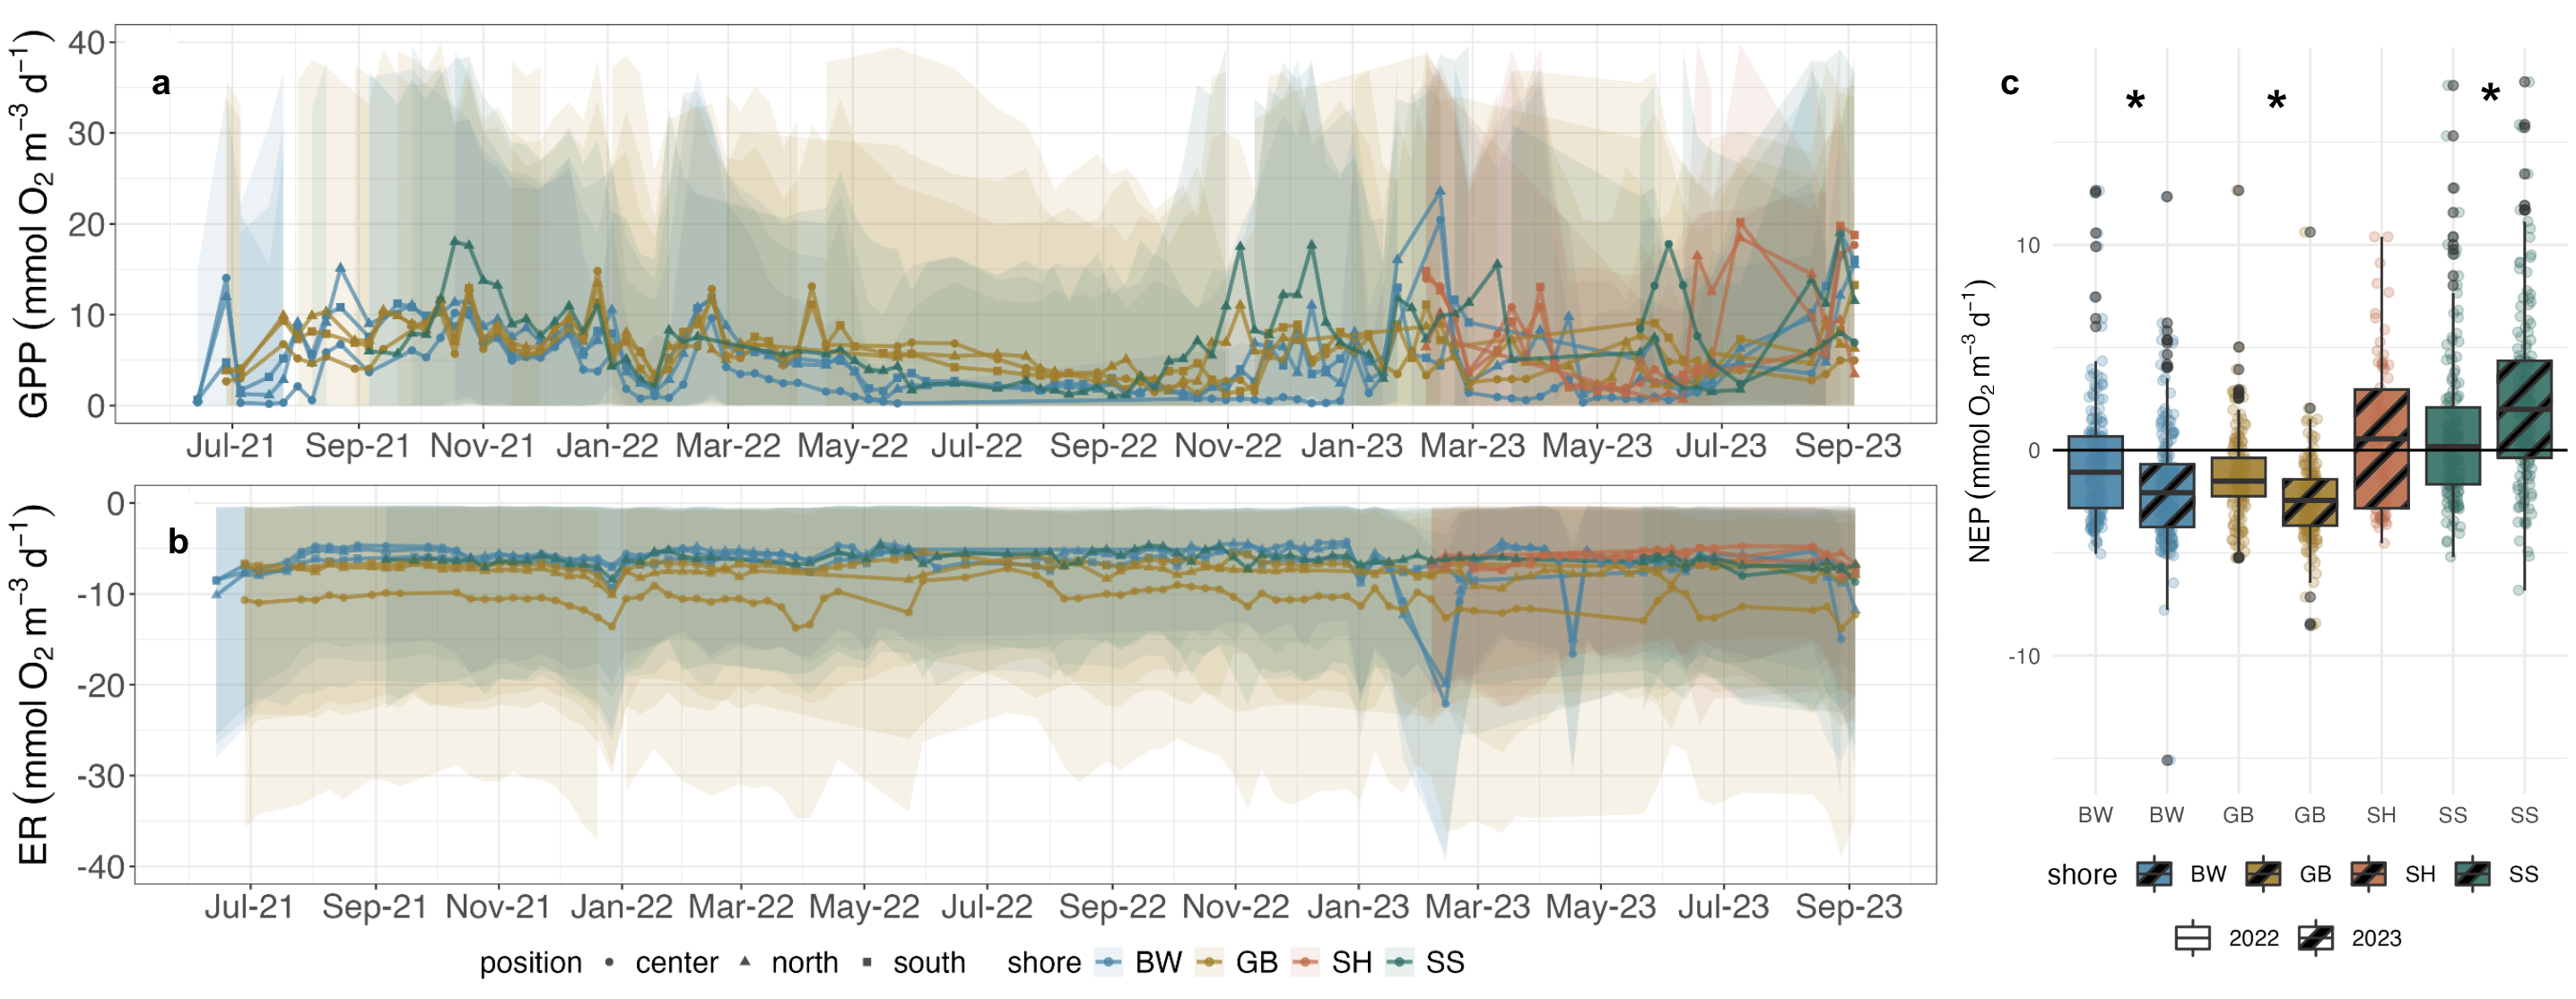
Average modeled daily a) gross primary productivity (GPP top) and b) ecosystem respiration (ER bottom) in nmol O2 m-3 d-1 from June 2021 to September 2023 across 3 individual sensors at two instrumented nearshore locations (Blackwood: BW and Glenbrook: GB) and two nearshore locations away from inflowing streams (Sunnyside: SS and Slaughterhouse: SH). c) Differences of dry (2022) to wet (2023) water year differences (October 1st to September 6th) for NEP in nmol O2 m-3 d-1. Stars represent large differences ANOVA (p < 0.05) in NEP from wet and dry years. Color corresponds to site (BW in blue, GB in gold, SS in green, and SH in orange), and shading represents the upper (95%) or lower (5%) credible intervals of each posterior estimate of daily GPP or ER.
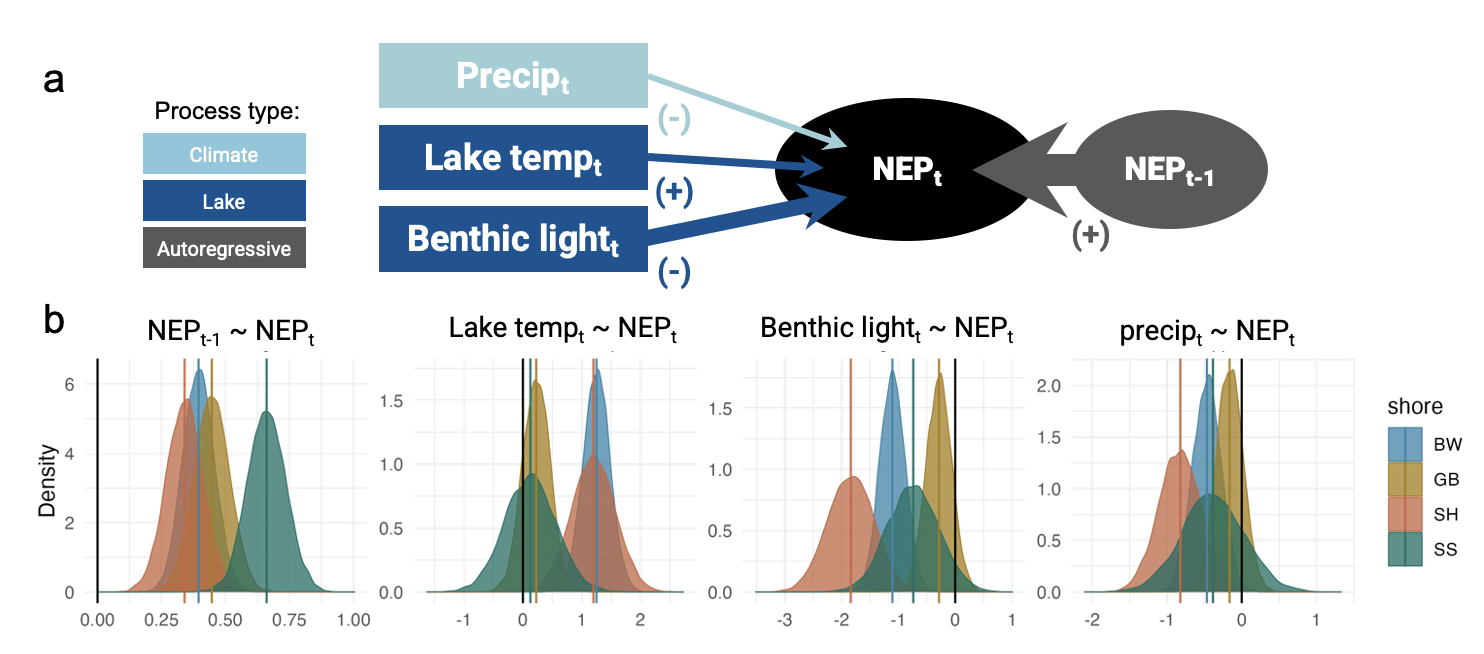
Results from Bayesian SEM for NEP in nmol O2 m-3 d-1 at time t at BW (in blue), GB (in gold), SS (in green), and SH (in orange) for a subset of overlapping data from all four sites (February to September 2023). a) The SEM structure for how NEP may be a function of precipitation, lake temperature, benthic light. Where color corresponds to climate processes like precipitation (dark blue for lake processes and gray for autoregressive processes), and arrow weight represents relationship strength for each parameter. b) The posterior estimates generated from each SEM parameter color-coded by shore, where mean posterior estimates are indicated by vertical lines and the black vertical line depicts zero.
Stay tuned for publication updates! Data available in 2025.
Download .pdf of slides from MtnClim 24 presentation
Special thanks to the Blaszczak field and laboratory team members (Link) Rob Miller, Helen Lei, Taryn Elliot, Ian Halterman, and Keenan Seto, and (Dillon Ragar), who helped collect and process the survey data; The University of Reno’s Global Water Center (Link) and Chandra lab members (Link), especially Emily Carlson, Erin Suenaga, Elizabeth Everest, and Zach Bess; Tahoe National Forest; and the residents of Glenbrook Nevada, especially Gary and Susan Clemons.