The influence of mountain streamflow on nearshore metabolism in a large, oligotrophic lake across drought and wet years.
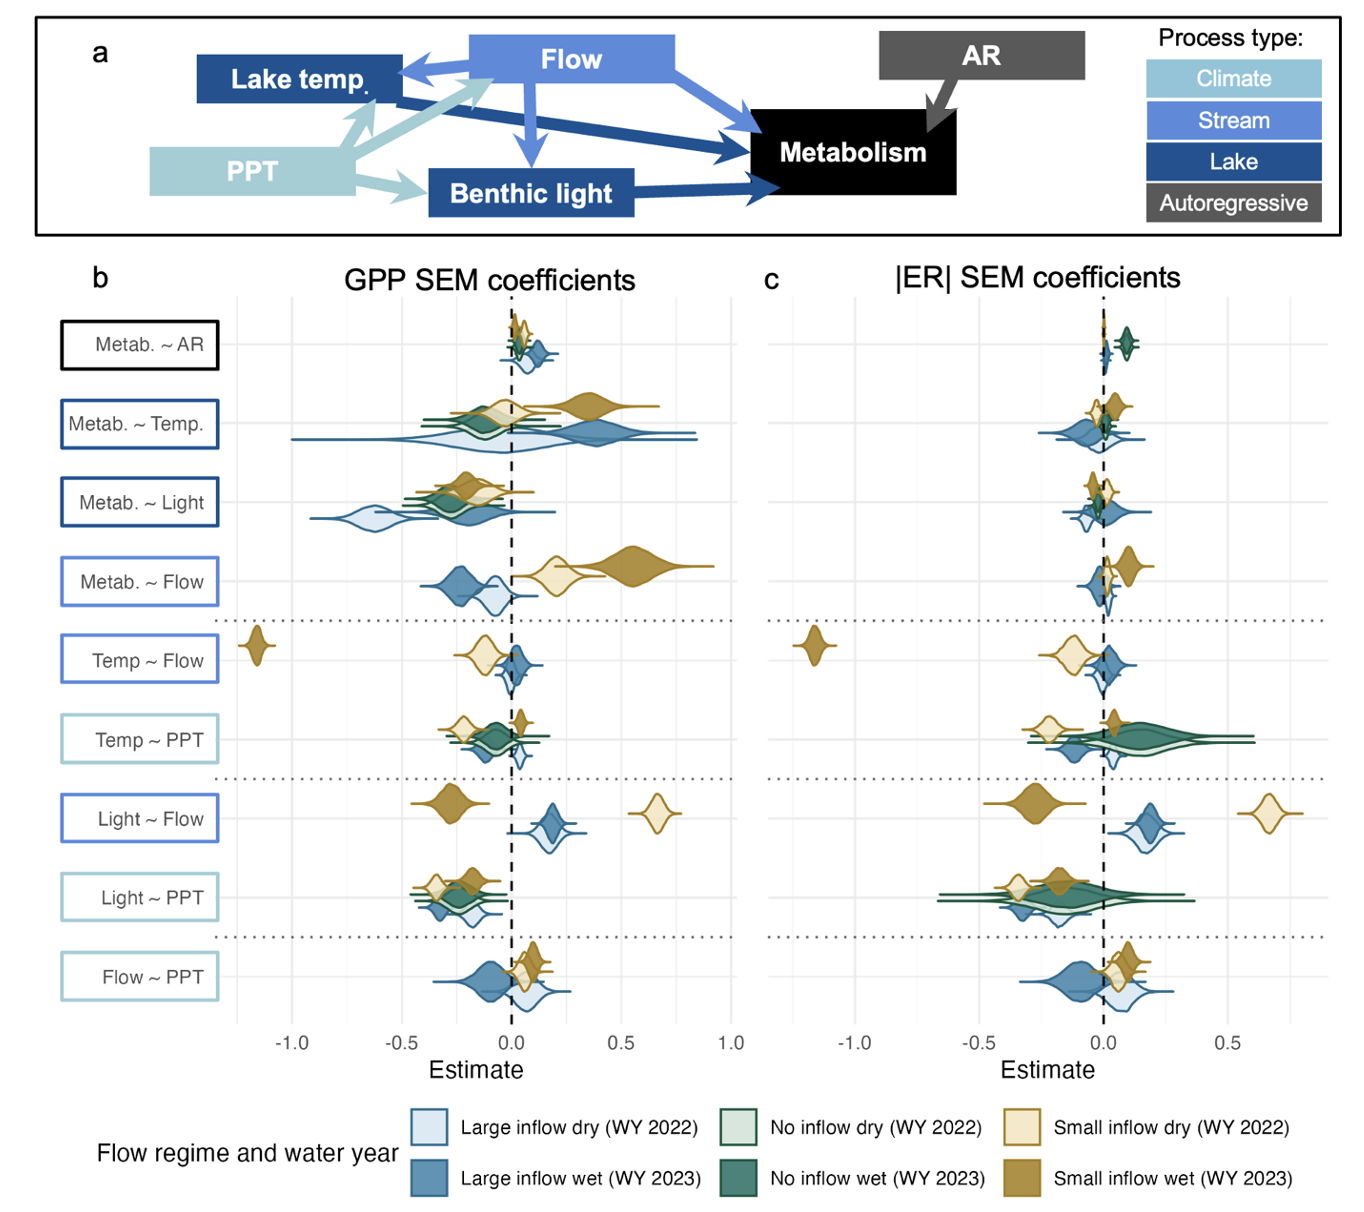
This work examines how streamflow influences nearshore productivity in Lake Tahoe under contrasting wet and dry years, focusing on shorelines with varying inflow levels. By evaluating streamflow for shores with large, small, or no stream inflows (four locations across two shores) during two contrasting water years (one drought and one wet), this work showed how streamflow reduces water temperature, light availability, to indirectly influence nearshore metabolism in ways that varied with inflow size. This work underscores how oligotrophic littoral productivity varies across shorelines and in response to hydrological conditions, with streamflow and precipitation exerting contrasting effects on metabolism depending on the proximity to inflowing streams.
Co-authors: Heili Lowman, Jasmine Krause, Leon Katon, Ramon Naranjo, Facundo Scordo, Adrian Harpold, Sudeep Chandra, and Joanna Blaszczak.
Link to article published Limnology and Oceanography.
Download data associated with the poject
Download .pdf of slides from MtnClim 24 presentation
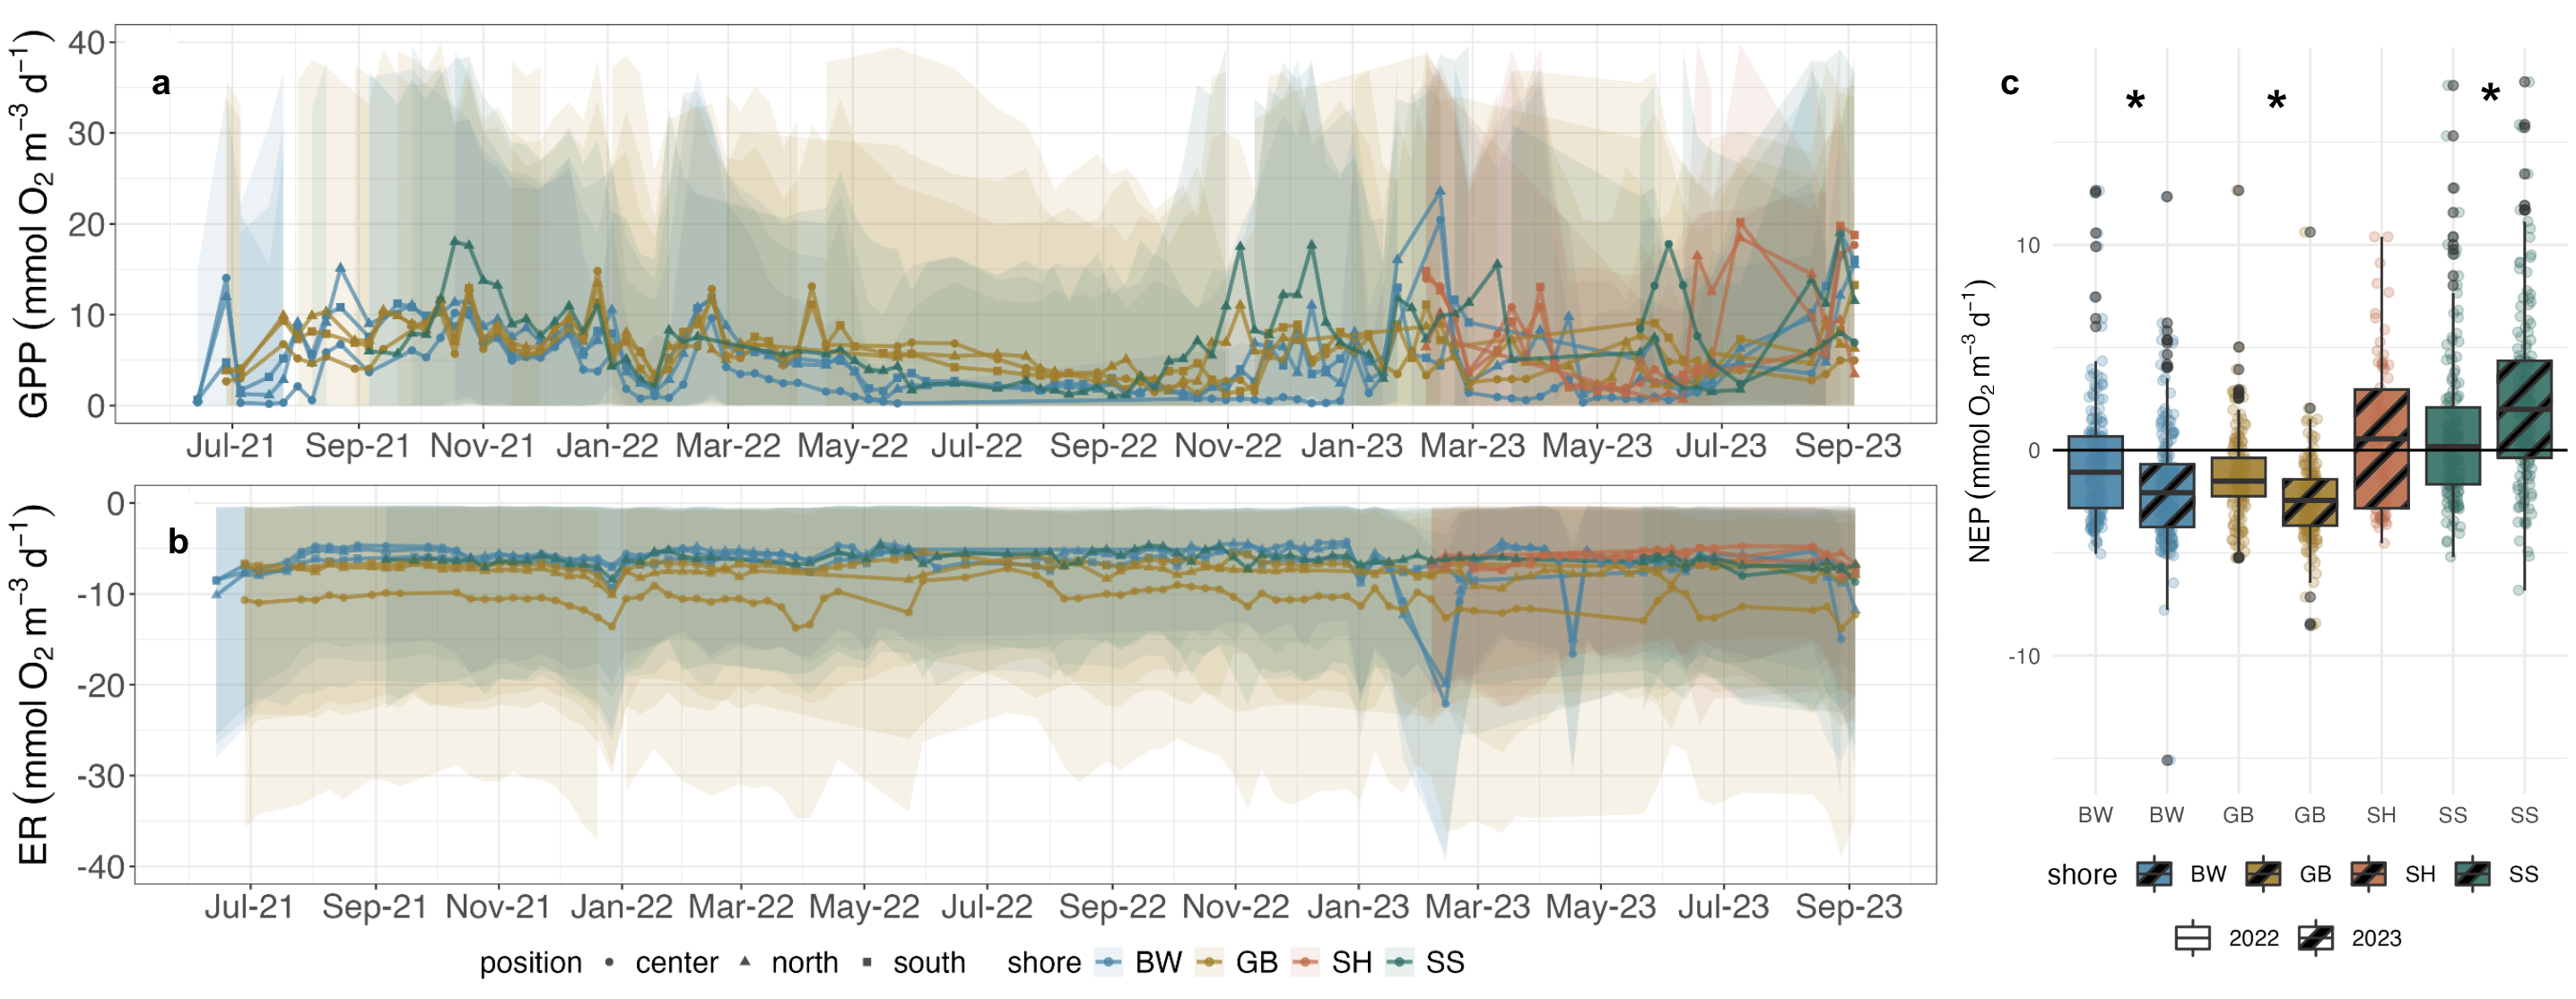
Average modeled daily a) gross primary productivity (GPP top) and b) ecosystem respiration (ER bottom) in nmol O2 m-3 d-1 from June 2021 to September 2023 across 3 individual sensors at two instrumented nearshore locations (Blackwood: BW and Glenbrook: GB) and two nearshore locations away from inflowing streams (Sunnyside: SS and Slaughterhouse: SH). c) Differences of dry (2022) to wet (2023) water year differences (October 1st to September 6th) for NEP in nmol O2 m-3 d-1. Stars represent large differences ANOVA (p < 0.05) in NEP from wet and dry years. Color corresponds to site (BW in blue, GB in gold, SS in green, and SH in orange), and shading represents the upper (95%) or lower (5%) credible intervals of each posterior estimate of daily GPP or ER.
Thanks to the Blaszczak field and laboratory team members (Link), Rob Miller, Meredith Brehob, Helen Lei, Taryn Elliott, Ian Halterman, Molly Ferro, Keenan Seto, Wubneh Belete Abebe, Rija Masroor, Colette Berkenfield, Robert Padan, Emily Burt, and Dillon Ragar, who helped collect and process the survey data.
Thanks to Dr. Robert O. Hall and Dr. Adam Ward at the Flathead Lake Biological Station and the H.J. Andrews Experimental Forest, respectively, for their expert technical guidance and support in characterizing gas exchange measurements.
Tahoe National Forest; and the residents of Glenbrook Nevada, especially Gary and Susan Clemons.
This work was supported by the National Science Foundation (NSF) under award OIA-2019528 and by the Nevada Division of State Lands. Kelly Loria was supported by an NSF Graduate Research Fellowship (No. 2020000930863). Any use of trade, firm, or product names is for descriptive purposes only and does not imply endorsement by the U.S. Government.